The Platform Dashboard provides a centralized overview of key metrics, such as metadata metrics, mapping metrics, marketplace metrics, and insights on data governance, data lineage, data sources, user activity, and data quality.
The dashboard aims to assist executives and administrators in understanding erwin DI's performance, usage, and value creation of erwin DI within the organization. It helps you to analyze the activities of different modules based on domains (catalogs) and the creation trends of assets.
Ensure that the roles assigned to dashboard users have the necessary access and permissions. For more information, refer to the Creating Roles topic.
To access the Platform Dashboard, go to Application Menu > Platform Dashboard.
The Platform Dashboard page appears.
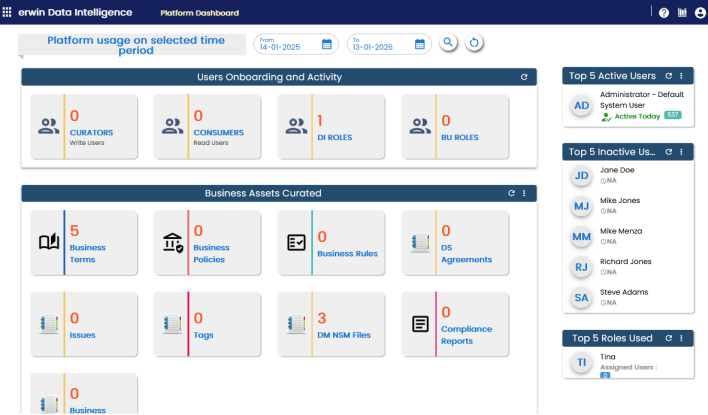
Each card is clickable and displays information using charts or graphs that provide a snapshot of the underlying data.
You can use the Platform usage on selected time period option to filter module usage for specific time periods. To select a period, click ![]() under From and To fields and then click
under From and To fields and then click ![]() . To reset the search results, click
. To reset the search results, click ![]() .
.
|
UI Section |
Function |
|---|---|
|
Users Onboarding and Activity |
Displays the number of Curators (Write Users), Consumers (Read Users), DI Roles, and BU Roles. |
|
Business Assets Curated |
Displays the number of each type of business asset. |
|
Business Categories Curated |
Displays the number of each type of business category. This section is available only when you switch to Categories. To view this section, click |
|
Marketplace Assets Curated |
Displays the number of each type of marketplace asset. |
|
Marketplace Categories Curated |
Displays the number of each type of marketplace category. This section is available only when you switch to Categories. To view this section, click |
|
Data Sources Activity |
Displays the number of onboarded and refreshed data sources. |
|
Source To Target Mappings and Reference Data |
Displays the number of source to target mappings and reference data. |
|
Top 5 Active Users |
Displays a list of top five active users based on login count. |
|
Top 5 Inactive Users |
Displays a list of top five inactive users based on login count. |
|
Top 5 Roles Used |
Displays a list of top five roles based on login count. |
Using the platform dashboard, you can view and analyze activity and usages of the following modules: